
Introduction — a short kitchen story with volts
I once watched a tram driver glance at an empty platform the way a chef checks an empty pan — expecting heat, but seeing none. In that pause, I thought about how often systems promise power but deliver friction instead. The pantograph charger sits in that exact space: a neat mechanical arm that should make electric transit effortless, but often doesn’t. (Think of it like a stove top that sometimes won’t click on.)
Here’s the data bite that made me sit up: cities upgrading fleets report charging downtime that eats into schedules by 8–15% on average — and yes, that hits operations and rider trust. So how do we move from frustrating stops to smooth, predictable energy transfer? I’ll walk you through the weak spots, the clever fixes, and what to look for next — a guided tasting menu for engineers and planners alike.
We’ll start by peeling back the conventional fixes and the hidden pains operators live with — then look ahead to better plates, I mean—platforms.
Part 2 — Why conventional fixes fall short (deep dive into the pantograph charging solution)
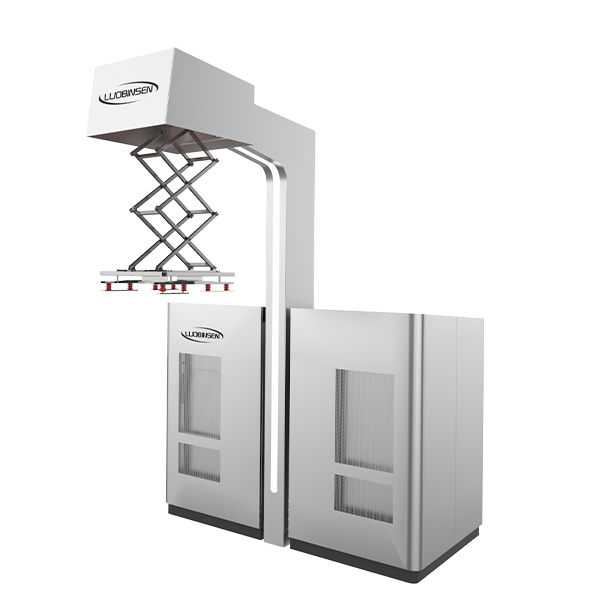
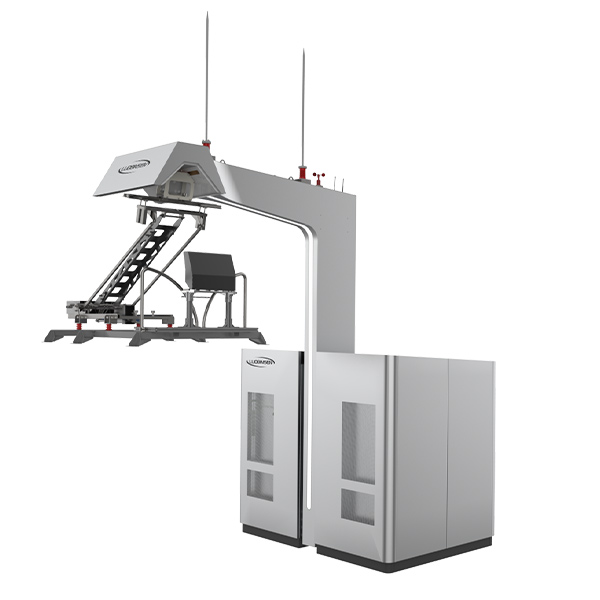
When I say pantograph charging solution, I mean the full system: the pantograph current collector, control logic, and the power electronics behind it. Too often, the industry treats the pantograph as a bolt-on — a simple mechanical reach up to the catenary. But the real failure points are in systems integration: poor synchronization between the pantograph motion and the power converters, control firmware that doesn’t handle brief misalignments, and overly rigid safety logic that trips too early. I’ve seen projects where the pantograph worked fine in the lab but faltered in rain, crosswind, or at higher vehicle speeds. Look, it’s simpler than you think when you know where to look.
What’s the bottleneck?
In technical terms, the trouble often lives in three places: mismatch in contact impedance, latency in edge computing nodes that manage the handshakes, and mechanical wear that changes the geometry over time. Those are industry terms you’ll see on spec sheets — contact resistance, drive electronics, and catenary interface — and they matter. A marginal increase in contact resistance raises heat and reduces efficiency; lagging telemetry prevents timely fault correction; and small mechanical shifts create repeated micro-arcs that shorten component life. These are the hidden nuisances that chip away at uptime and cost you real money every month.
From my hands-on work, one overlooked user pain is the diagnostic gap. Operators get a general fault code — “contact loss” — but no clear timeline or remedy. That uncertainty forces conservative schedules (added buffer time) and unnecessary maintenance checks. Another is the human factor: maintenance crews need clear, quick guidance when a pantograph misaligns during peak hours — not a long service manual. These gaps are why some cities prefer lengthy wired stops over dynamic pantograph charging, even though the second option can be faster and greener when done right — funny how that works, right?
Part 3 — Future outlook: practical next steps and real-world comparisons
Looking ahead, I prefer a balanced approach: combine incremental upgrades with strategic tech bets. For transit agencies considering new installs or retrofits, evaluate solutions that add smarter sensing at the interface (low-latency edge computing nodes), robust power converters with adaptive control, and modular pantograph heads that are easy to replace. Case studies from pilot corridors show that pairing smart controls with predictive maintenance cuts unplanned downtime by up to 40% — real numbers, not just theory. Also worth noting: integrating the pantograph system into each site’s wider energy strategy (storage, peak shaving) changes the cost picture significantly.
Real-world Impact
Take one example: a mid-size city that shifted from static overnight depot charging to opportunistic pantograph top-ups at selected stops. They added simple sensors to monitor contact status and used short burst charges at scheduled layovers. The result? Shorter dwell-time penalties and fewer battery-size requirements for buses — which reduced fleet procurement costs. The catch is implementation discipline: you need consistent alignment procedures, trained crews, and data-driven thresholds for when to intervene. Otherwise, you get marginal gains that disappear under real-world variability.
Before you decide, measure three things I now always recommend: 1) alignment tolerance — how much misalignment a design tolerates before efficiency drops; 2) response latency — how fast the control system corrects or isolates faults (ms range matters); and 3) lifecycle servicing ease — how quickly parts can be swapped during peak operations. Those three metrics tell you more than flashy specs. I’ve used them on multiple projects and they helped cut surprises during rollouts — and you will want fewer surprises.
For teams comparing vendors and setups for an electric ev charging station rollout or a dedicated tram line, focus on the whole-system view: mechanical, electrical, and operational workflows together. Weigh short-term gains against longer-term resilience, and prioritize solutions that make maintenance predictable. I’ll end with a plain thought: choose systems that let your crews act fast and confidently — because when power meets practice, people notice the difference. For vendor options and further reading, consider solutions from Luobisnen.