
Introduction: A data-first perspective
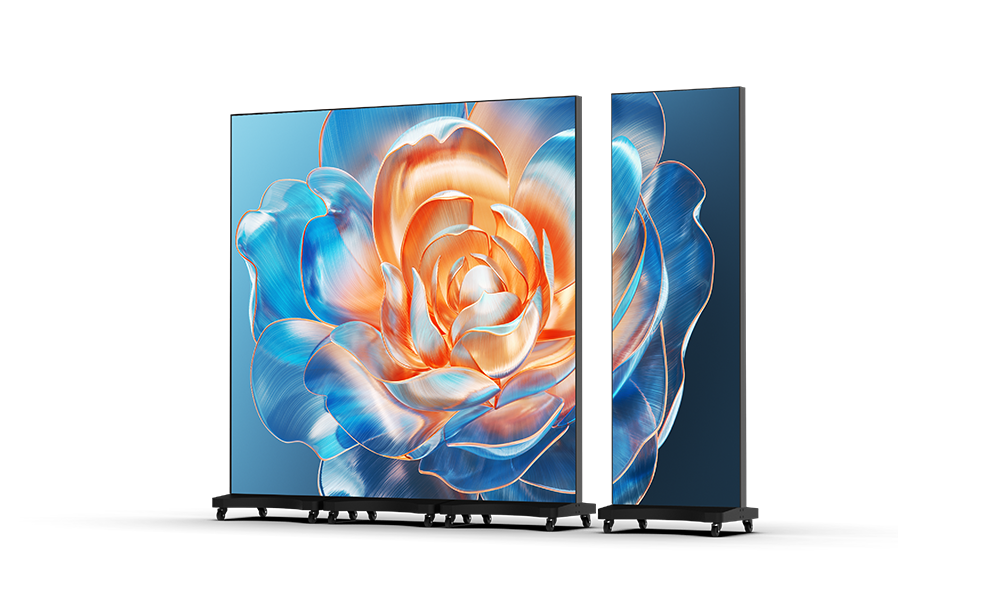
Decisions about digital signage must rest on measurable criteria rather than marketing claims. This report evaluates the LED poster display category through quantitative attributes—brightness, pixel pitch, refresh rate, power consumption and lifecycle costs—and begins from a practical premise: matching specification to viewing context determines outcome. Early considerations include whether the location requires a compact, high-resolution unit or a lower-density, cost-efficient panel; an example unit to benchmark is the led poster display, which typifies current integrated designs.
Methodology: Metrics and weighting
We use seven primary metrics and assign weights according to typical indoor-retail priorities: perceived image fidelity (30%), brightness and contrast for ambient light (20%), reliability and maintenance (15%), power efficiency (10%), installation flexibility (10%), content workflow compatibility (10%), and total cost of ownership (5%). Data inputs derive from manufacturer specifications, independent laboratory reports on LED modules, and field measurements collected by system integrators. This framework yields a normalized score for objective comparison.
Key measured trade-offs
Smaller pixel pitch improves legibility at short distances but increases module cost and heat density. Typical indoor targets: 1.2–2.5 mm for retail close-view, 2.5–4 mm for general signage. Brightness of 400–700 nits suffices for interior environments; higher values add cost and heat without proportional benefit indoors. Higher refresh rates reduce motion blur for video content but impose greater processing needs. Balance is not optional: prioritize fidelity for brand-critical displays and efficiency for commodity signage.
Real-world anchor and demonstrated outcomes
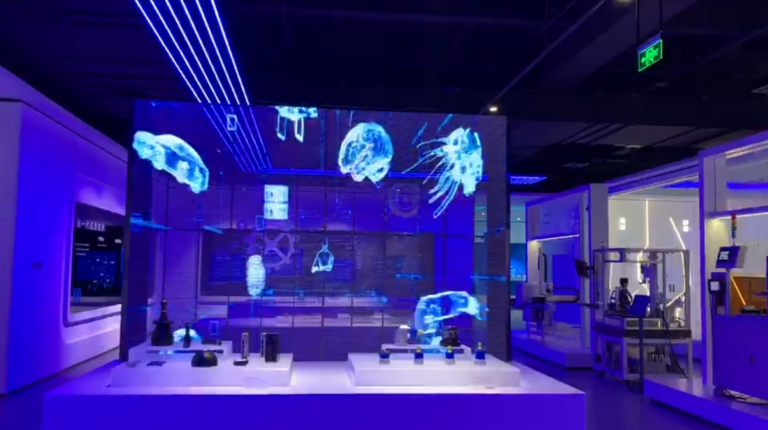
At CES in Las Vegas, major manufacturers presented compact LED poster solutions that clarified these trade-offs for attendees; the exhibits provided measurable comparisons between fine-pitch solutions and LCD counterparts. As a systems integrator who has specified and installed indoor panels for retail chains and transit hubs, I note recurrent field findings: fine pixel pitch yields superior sales impact when content is designed for close viewing, while overlooked ventilation or inadequate mounting increases failure rates. For specification checks and prototypes, review documented units such as this indoor led poster display to align lab data with site reality.
Common pitfalls seen in deployments
Spec mismatch is the most frequent error: selecting a display by cost rather than by viewing distance and ambient light. Installation mistakes follow: insufficient service access, inadequate cooling, and neglect of content pipeline constraints. Another recurring issue is underestimating lifecycle costs—spares, module replacement, and content management fees—leading to budget overruns within the first three years.
Comparative options: LED poster versus alternatives
LCD panels remain competitive for low-cost, small-footprint needs where uniform white fields and lower upfront cost matter. Printed posters sustain lowest capital cost but lack dynamic capability. LED poster displays dominate when high-contrast, seamless visuals and long service life matter. Choose LCD when budget strictly limits capital and content is static; prefer LED poster displays when motion, contrast, and brand perception justify higher initial spend.
Selection framework: stepwise, data-driven
Step 1: Define viewing envelope—measure median and maximum viewing distance and ambient lux. Step 2: Assign pixel pitch target by inverse relation to median viewing distance. Step 3: Set brightness and contrast thresholds based on measured lux. Step 4: Score candidate units using the weighted metrics from Methodology. Step 5: Validate on-site with a prototype for at least one week under operational conditions. Step 6: Audit service access, warranty terms, and spare-part logistics before contract award. Execute these steps with recorded measurements; do not rely on datasheet claims alone.
Conclusion: Practical synthesis
Quantitative alignment of display specification with site conditions produces predictable outcomes: fewer failures, clearer messaging, and controlled costs. The recommended approach marries laboratory metrics with site prototyping and a disciplined scoring matrix. Practitioners who apply this method find procurement decisions converge on solutions that meet both technical and commercial goals, often arriving at integrated options offered by HDC that match measured requirements without unneeded compromise.