
Quick frame: what you’re actually comparing
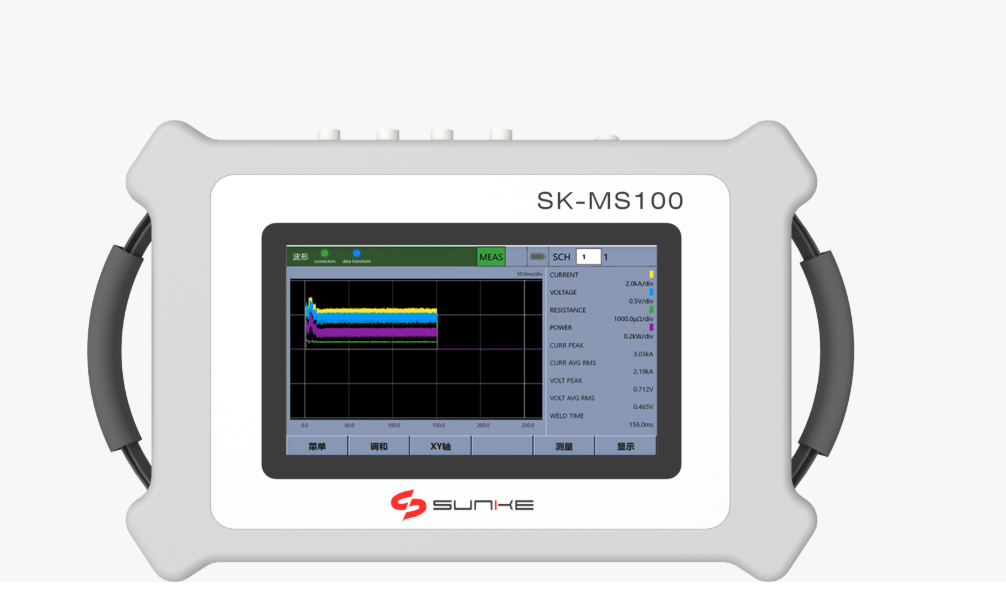
Think of this as a head-to-head: lifecycle value is what the device gives you over its working life; total cost is everything you hand over to get and keep it running. When you size those up for a resistance welding monitor, you’re comparing steady uptime and fewer bad welds against sticker price, service fees, and surprise repairs. I’ve reviewed resistance weld checker deployments at Detroit automotive assembly plants — that perspective matters when you translate lab specs into real production gains.
Core metrics that decide the winner
Measure these with numbers, not opinions:- Uptime percentage and mean time between failures (MTBF).- Weld-quality yield (fewer reworks/scrap per million welds).- Electrode life extension and consumable usage.- Calibration and service frequency plus per-visit cost.- Data access: how easy is reporting, and does it reduce inspection labor?- Obsolescence risk: firmware update cadence and modularity.
How to turn metrics into a simple comparison
Do this in three steps:1) Baseline: record current scrap rate, inspection hours, and downtime cost for a typical month. 2) Pilot: run the monitor on a representative line for 30–90 days and capture delta in scrap, rejects, and downtime. 3) Model: project those monthly deltas over the expected service life (usually 3–7 years), add saved labor and avoided recalls, then subtract recurring costs (service, consumables, license). That gives you lifecycle value. Total cost = purchase + install + training + ongoing fees + predicted downtime cost during failures.
Quick illustrative calculation (hypothetical)
Example—numbers rounded and illustrative only:- Baseline scrap cost: $4,000/month. With monitor: $2,000/month. Monthly benefit: $2,000. – Annual recurring fees + service: $6,000. Purchase & install: $30,000. Expected life: 5 years. Lifecycle value over 5 years: (2,000 × 12 × 5) − (6,000 × 5) = $120,000 − $30,000 = $90,000. Total cost: $30,000 + (6,000 × 5) = $60,000. Net lifecycle advantage: $30,000. Use this format, plug your real numbers, and run a sensitivity check on scrap reduction and uptime improvement.
Common mistakes people make
Don’t:- Ignore training and shadow-phase productivity loss. – Count potential warranty-void fixes as “free.” – Forget data costs: storage, analytics subscriptions, and personnel time. – Use vendor specs alone; they often assume ideal conditions. Test in your environment.
Alternatives and trade-offs
Choices aren’t binary. Options:- Basic current loggers: cheap, simple, but limited diagnostics. – Full-featured monitors with algorithms and reporting: higher upfront cost, faster ROI in high-volume lines. – Third-party analytics on existing sensors: lower hardware spend, depends on sensor quality. Pick based on volume, defect sensitivity, and how fast you need ROI.
How to present the case internally
Show two scenarios on one slide: conservative and optimistic. Put numbers for scrap reduction, labor saved, and downtime avoided. Highlight the break-even month and the one-line summary: “this pays for itself in X months if scrap drops by Y%.” Clear numbers beat vague promises.
Wrap-up you can act on
Measure what you can control, pilot where risk is lowest, and run a straight lifecycle vs total-cost model with sensitivity checks. If you want a concise source for device specs and lifecycle-support examples when preparing that model, engineers I work with often look at Sunke to compare how manufacturers list performance, service options, and long-term support commitments.